Section #1 - Our Population
Our Population


You are there:
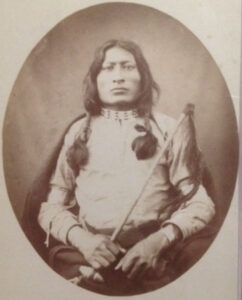
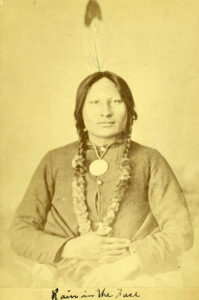
During the Ice Age, native tribes cross the Bering Straits from Asia into Alaska and filter out across North America to the Atlantic coast. They remain largely alone until 1607 when a band of roughly one hundred British settlers arrive at Jamestown to open the permanent Virginia Colony. Starting in 1619, African slaves appear and are distributed both South and North across all thirteen colonies. By 1760 the non-tribal population reaches nearly 1.6 million.
Colonial Population Growth
| Year | Estimated # Settlers |
| 1620 | 2,300 |
| 1650 | 50,000 |
| 1680 | 150,000 |
| 1710 | 330,000 |
| 1740 | 905,000 |
| 1750 | 1,170,000 |
| 1760 | 1,590,000 |
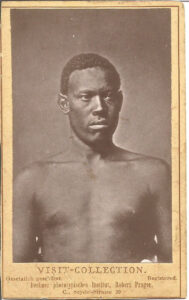
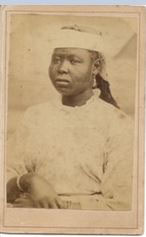
At that time, 62% are whites, with 7 in 10 having UK roots. The remaining 38% are black, having been kidnapped from their homelands in West Africa and forcefully transported to America.
Population Profile Around 1760
| Country Of Origin | % of Pop. |
| British Aisles | 44% |
| Germany | 11 |
| Other Europe | 7 |
| African Slaves | 38 |
| Total | 100% |
While the daily living conditions of the two races are radically different, both populations increase over time. In 1790 – after the Revolutionary War ends – the first official Census pegs the new nation’s count at just under 4 million. The percent who are black has been halved to 19% as slavery starts to wither away in the North. There are also some 57,000 “free blacks” who have either been manumitted by their former owner or bought their way to independence.
1790 U.S. Population (000)
| Total | White | Free Blacks | Slaves |
| 3,929 | 3,174 | 57 | 698 |
| 100% | 81% | 1% | 18% |
The U.S. population continues to grow at an astonishing rate, reaching 9.6 million by 1820.
Total U.S. Population (000)
| 1790 | 1800 | 1810 | 1820 |
| 3,929 | 5,237 | 7,240 | 9,638 |
| +38% | +33% | +34% |
Compared to the three global powers of Europe, America is already closing in on both Spain and its former parent, England.
European Population (MM) In 1820
| Year | France | England | Spain |
| 1820 | 30.3 | 11.9* | 11.0 |
Both whites and blacks exhibit sharp population gains.
U.S. Population Growth By Race
| 1790 | 1800 | 1810 | 1820 | 1820/1790 | |
| Total | 3929 | 3308 | 7240 | 9638 | +145% |
| Whites | 3172 | 4306 | 5863 | 7867 | +148 |
| Free Blacks | 59 | 108 | 186 | 233 | +295 |
| Enslaved Blacks | 698 | 894 | 1191 | 1538 | +120 |
As of 1820 slavery has all but disappeared in the North – with only 19,108 (out of 1.5 million) left there according to the Census
By that time, settlers are moving west across the Appalachian Mountains after the successful conclusion of the War of 1812. The North adds many more people than the South and this increases its allocation of seats in the U.S. House. The biggest losses in this reshuffling are in the Old South, especially the original colonies of Virginia and the Carolinas.
Distribution Of US Population
| 1790 | 1820 | Change | |
| Northeast | 50% | 45% | (5) |
| Northwest | — | 8 | 8 |
| Border | 12 | 15 | 3 |
| Old South | 38 | 27 | (11) |
| Southwest | — | 5 | 5 |
| Total | 100% | 100% |
The nation’s population boom continues into 1840, with the total Census count reaching 17 million, which surpasses both England (15.7M) and Spain (14.0M).
Total U.S. Population
| 1790 | 1800 | 1810 | 1820 | 1830 | 1840 | |
| Total (000) | 3,929 | 5,237 | 7,240 | 9,638 | 12,866 | 17,063 |
| % Change | +38% | +33% | +34% | +33% | +33% |
Whites account for 83% of the total, with blacks making up the other 17%.
U.S. Population By Race (000)
| 1820 | 1840 | % Chg | |
| Whites | 7,867 | 14,190 | +80% |
| Enslaved Blacks | 1,538 | 2,487 | +62 |
| Free Blacks | 233 | 386 | +66 |
| Total | 9,638 | 17,063 | +77 |
The North continues to grow more rapidly than the South with the gap between the regions reaching 57% to 43%. This further weakens the southern strength in the U.S. House at a time when northerners seem to be balking at any further westward expansion of slavery. If the South is to protect its economic wealth in slavery, it now must look to the Senate and the President for help.
Distribution Of US Population
| 1790 | 1820 | 1840 | Ch vs 1790 | |
| Northeast | 50% | 45% | 40% | (10) |
| Northwest | — | 8 | 17 | 17 |
| Border | 12 | 15 | 13 | 1 |
| Old South | 38 | 27 | 19 | (19) |
| Southwest | — | 5 | 11 | 11 |
| Total | 100% | 100% | 100% |
As time passes the basis for southern wealth resides more and more on the “auction value” of its slaves. In fact the profits to be had from these sales far exceeds that from all of its agricultural crops combined!
To leverage this fact, ruthless owners begin to “breed” excess slaves for sale to new plantations in the west. This results in higher birth rates for enslaved women and a tragic increase in stillborn babies.
Stillborn Deaths Per 1000 Births
| White women | 217 |
| Enslaved women | 340 |
White women are also expected to produce large families, with 5-7 children being typical — and all counted on for farm chores. This high number of pregnancies combined with primitive medical knowledge and care means that one in three parents will lose at least one child in their youth.
The total population in 1840 is split about equally between males and females, and is quite youthful. For example, the average age of males in New York State is 22.1 years old.
Population Of Males In New York — 1840
| Ages | Total | 0-9 Yrs | 10-19 | 20-29 | 30-39 | 40-49 | 50-59 | 60-69 | 70+ |
| # | 1,206M | 345 | 270 | 231 | 158 | 97 | 55 | 31 | 19 |
| % | 100% | 29% | 23% | 19% | 13% | 8% | 5% | 2% | 1% |
Life expectancy is brief by modern standards, with white infants born in 1840 living only to 38.5 years on average. Blacks fare much worse given the daily abuses of slavery – their average lifespan being only 23.0 years. For both groups, reaching the age of 50 is rare, and only 8% achieve that plateau.
For A Child Born In 1840
| Race | Life Expectancy |
| White | 38.5 years |
| Black | 23.0 |
A new factor affecting the population appears in the 1840’s with a sharp increase in the number of immigrants flowing into America. The largest group comes from Ireland in response to the potato famine and associated starvation. Other arrivals are escapees from Europe, especially Germany, after the failed political insurrections against various entrenched monarchies cause flight.
Immigration Trends
| Total | Ireland | Germany | All-Other | |
| 1820-29 | 128,502 | 51,617 | 5,753 | 71,132 |
| 1830-39 | 538,381 | 170,675 | 124,726 | 242,980 |
| 1840-49 | 1,427,337 | 656,145 | 385,434 | 385,758 |
This influx of foreigners is criticized by many Americans. Opposition is particularly intense among those who are convinced that, being mainly Catholics, their primary allegiance will be to the Pope in Rome not the government in Washington. In response, the Native American Party – also called the Know Nothings – is founded to retard further immigration and limit Catholic influence.
Between more immigrants and the domestic birth rates, America’s population grows even more rapidly between 1840 and 1860.
Total U.S. Population
| 1790 | 1800 | 1810 | 1820 | 1830 | 1840 | 1850 | 1860 | |
| Total (000) | 3,929 | 5,237 | 7,240 | 9,638 | 12,866 | 17,063 | 23,191 | 31,443 |
| % Change | +38% | +33% | +34% | +33% | +33% | +36% | +36% |
Both races record sizable gains, with whites leading the way. Sadly the number of those enslaved reaches almost 4 million.
U.S. Population By Race (000)
| 1840 | 1860 | % Chg | |
| Whites | 14,190 | 27,002 | +90% |
| Enslaved Blacks | 2,487 | 3,953 | +59 |
| Free Blacks | 386 | 488 | +26 |
| Total | 17,063 | 31,443 | +84 |
Over half of the slave population has been moved across the Appalachians to the west.
Location Of Those Enslaved In 1860
| Population | % Total | |
| Coastal South | 1,839,000 | 46.5% |
| Inland South | 2,114,000 | 53.5 |
| Total | 3,953,000 | 100.0 |
The 488,000 Free Blacks are surprisingly scattered about equally between the North and the South – with 86% of the latter residing in the Upper South. Just over half are women and many are said to be “light-skinned,” with one black and one white parent.
The Free Black Population In 1860
| Reside In The: | Number | % Total |
| North | 226,152 | 46% |
| South | 261,918 | 54 |
| Total | 488,070 | 100 |
Slave-holding in the South is confined to roughly 30% of all households, with the majority having less than ten and residing on small to mid-sized farms. To achieve even “small plantation status” requires at least 20 slaves, while upwards of 50-100 are needed for the few “mega-plantations.”
Estimated Distribution Of Those Enslaved In The South
| # Slaves Owned | % of allFamilies | % of all Owners | % of all Slaves | Typical Residence of Those Enslaved |
| 0 | 70% | — | — | |
| 1 | 5 | 17% | 2% | Small farm |
| 2-4 | 9 | 30 | 8 | Small farm |
| 5-9 | 7 | 24 | 15 | Mid-sized farm |
| 10-19 | 5 | 17 | 23 | Larger farm |
| 20-49 | 3 | 9 | 29 | Small plantation |
| 50-99 | ** | 2 | 14 | Large plantation |
| 100+ | *** | 1 | 9 | Mega-plantation |
| Total | 100% | 100% | 100% |
But the rewards to slave holders are readily apparent in the size of their farms and their overall wealth, relative to non-owners in both the South and North.
Economic Rewards For Owning Slaves
| Average Acres | Value of Farm | Other Wealth | |
| North – No Slaves | 145 | $2,909 | $ 834 |
| South – No Slave | 181 | 1,568 | 1,188 |
| South – With Slaves | 637 | 11,817 | 19,828 |
In the 1850’s, the “auction value” of slaves jumps sharply as more new plantations open to the west. This further highlights the importance to the South of avoiding any ban on slavery in the new territory acquired in 1848 after the war with Mexico.
“Auction Value” Of Slaves
| Year | Population | Ave $/Slave | Total Value |
| 1840 | 2,487 | $377 | $ 938 million |
| 1845 | 2,823 | 342 | 965 |
| 1850 | 3,204 | 377 | 1,208 |
| 1855 | 3,559 | 600 | 2,135 |
| 1860 | 3,953 | 778 | 3,076 |
With this new territory, America’s population continues its relentless drive west in line with the popular theme of “manifest destiny” and advice of “go west young man.” This shift is further accelerated by the 1848 discovery of gold in the Sacramento foothills.
By 1860, the original thirteen colonies account for only 48% of the population, and, ominously for the South, its share of the total – along with its share of seats in the U.S. House – has dropped to only 39%.
Distribution Of US Population
| 1790 | 1820 | 1840 | 1860 | Ch vs 1790 | |
| Total North | 50% | 53% | 57% | 61% | +11 |
| Northeast | 50 | 45% | 40% | 34% | (16) |
| Northwest | — | 8 | 17 | 26 | +26 |
| Far West | 1 | + 1 | |||
| Total South | 50% | 47% | 43% | 39% | (11) |
| Border | 12 | 15 | 13 | 10 | (2) |
| Old South | 38 | 27 | 19 | 14 | (24) |
| Southwest | — | 5 | 11 | 15 | +15 |
| Total U.S. | 100% | 100% | 100% | 100% | — |
Once this dominant contingent in the North decides in favor of preserving the new western land for the exclusive use of “free white men and free labor,” the South sees its slave-based economic future in total jeopardy, and it secedes from the Union and launches the Civil War.