Section #10 - Our Occupations, Incomes and Purchasing Power
Our Occupations, Incomes and Purchasing power
You are there:
as America’s marketplace economy takes off, a nation of farmers discovers attractive new ways to earn a living.
The English joint stock companies that finance the 17th century colonies are driven first and foremost by the wish to find deposits of gold and silver in the new land. But when that fails, the settlers are left searching for other exports to satisfy their investors. They find the answer in a range of commodities.
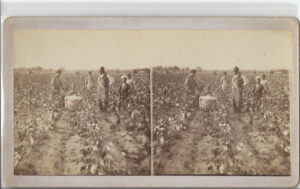
In the north there is an ample supply of raw lumber for ship-building, along with what Bostonians call the “sacred cod,” the catch that spawns the fishing industry in America. Europe also proves eager for New England rum and fur pelts used in top hats and winter clothing. The south relies on agricultural exports, mainly its key cash crops: tobacco, rice, sugar, indigo and cotton.
By 1763 each colony has developed its own sources of export income.
Primary Commodities Produced As Of 1763
| Colony | Goods |
| Massachusetts | Cod, herring, timber, iron |
| New Hampshire | Fish |
| Rhode Island | Rum |
| Connecticut | Corn, horses |
| New York | Furs |
| Pennsylvania | Flax, wheat, iron |
| New Jersey | Sheep, apples, copper |
| Maryland | Peaches |
| Virginia | Tobacco, furs, cattle, iron |
| North Carolina | Tobacco, pigs, cattle, furs |
| South Carolina | Rice, indigo, cattle |
| Georgia | Rice, indigo, silk, hides |
The colonists ship their raw commodities to England and receive a variety of “finished goods” turned out in British manufacturing facilities. These range from articles of clothing – shirts, trousers, dresses, shoes – to household supplies – furniture, tableware, linen – to other “basics” — tools, glass, paper and tea.
As goods flow in and out, British officials collect tariffs (i.e. taxes) on them to add to corporate and Crown profits. The Royal Navy plays an important role in guaranteeing this trade. It guards the sea lanes to Britain and battles two main threats – smugglers seeking to avoid payment of tariffs, and pirates intent on stealing shipments for themselves.
Exports increase steadily from $22 million in 1790 to $96 million in 1805, before disruptions set in related to the Napoleonic Wars in Europe and the War of 1812 in America.
Value of American Exports and Imports
| Year | 1790 | 1795 | 1800 | 1805 | 1810 | 1815 |
| Exports (MM) | $22.2 | $48.0 | $71.0 | $95.6 | $66.8 | $52.6 |
| Imports (MM) | 23.0 | 69.8 | 91.3 | 120.6 | 85.4 | 22.0 |
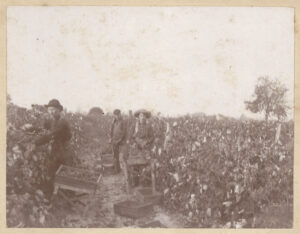
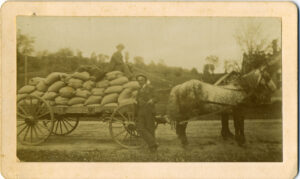
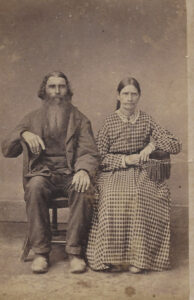
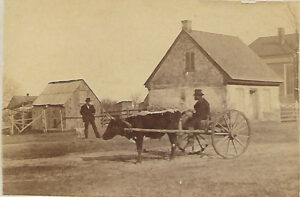
While some Americans are engaged in the export/import sectors, the vast majority earn their living as the “yeoman farmers” envisioned by Thomas Jefferson. In the 1790 Census, 93% reside on farms and only 7% in urban centers. Farm sizes average around 50 acres and produce enough food to feed the family with some left over to barter or sell.
Typical Farm Sizes
| Acres | Percent |
| Under 10 acres | 3% |
| 10-19 | 7 |
| 20-49 | 31 |
| 50-99 | 28 |
| 100-499 | 29 |
| 500-999 | 2 |
| 1000 and over | * |
Given a lack of reliable economic data, it is difficult to tell how well off these farmers are at the time. That is, how much disposable income they had, and how that related to the cost of the goods they were buying: e.g. clothing, farming equipment and soforth.
But the growth in the nation’s Gross Domestic Product in total and on a per capita basis says that the wealth of the average farmer was strengthening, except during periodic recessions, such as the one around 1818-1825.
Gross Domestic Product For The United States*
| Year | 1790 | 1800 | 1810 | 1820 | 1830 | 1840 | 1850 | 1860 |
| GDP (MM) | $189 | $480 | $706 | $710 | 1022 | 1574 | 2581 | 4387 |
| Per Capita | 48 | 91 | 98 | 74 | 79 | 92 | 111 | 139 |
To further quantify the situation, one historian of the colonial period, John Bach McMaster, estimates that the “average rate of wages the land over in the 1790’s was around $65 a year.” Thus a laborer might be hired to do a job for around 20 cents a day – which gives meaning to the advice “watch your pennies.”
Hard facts about the distribution of wealth are also unavailable, but some guesses can be made.
On the order of 9 in 10 colonists are small farmers, the only difference between them being those in the south who own slaves and are therefore wealthier. Of the remaining 10%, most are unskilled laborers living in urban centers and likely working on the shipping wharves, or those engaged in various non-agricultural trades such as lumbermen, trappers or seamen. That leaves the Top 1-2% — early northern businessmen and southern plantation owners – who are extremely rich by comparison
Guesstimated Economic Classes For Whites In 1790
| Relative Wealth | Who | % Population |
| Below Average | Unskilled laborers in urban centers | 7% |
| Small southern farmers w/o slaves | 30 | |
| Average | Small northern farmers | 45 |
| Lumbermen/fishermen/trappers/etc. | 3 | |
| Above Average | Small southern farmers with slaves | 13 |
| Very Rich | Southern plantation owners | 1 |
| Northern businessmen/financiers | 1 |
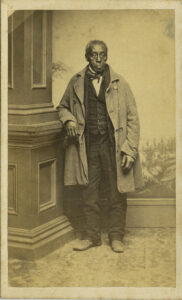
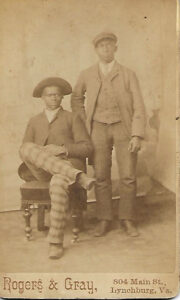
Of course none of this applies to the 14% of the total population who are African-Americans. Nine in ten of them are enslaved, and have no hopes for income. The rest are “freedmen” typically confined to segregated enclaves and surviving at the lowest rung on the economic ladder.
By around 1840, America’s economic landscape is changing.
In New England, one in five households move off their farms and live in urban centers — and that number will grow to 36% by 1860. Some others who continue to reside on farms will commute to cities to earn their income.
This shift traces to the rise of America’s industrialized and diversified economy, and the number of attractive new wage earning jobs that accompany it.
These new jobs are wide ranging in content and pay.
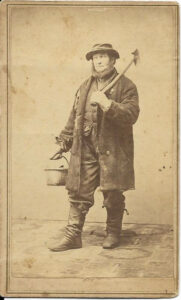
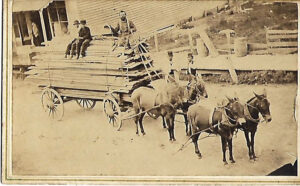
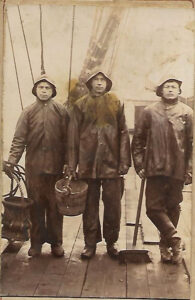
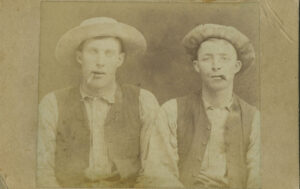
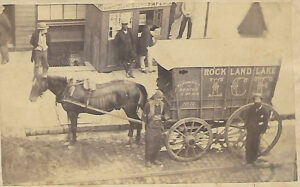
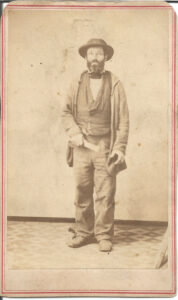
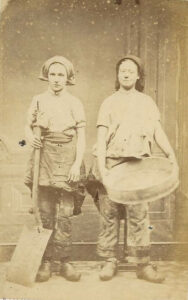
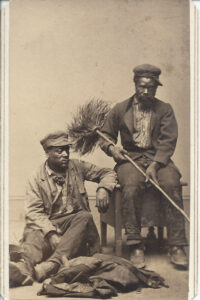
At the lower end of the spectrum are “unskilled workers,” such as day laborers, longshoremen and draymen, and factory workers, who rely on muscle power, and are hired or laid off at the whim of their employers. Their jobs are always threatened, especially by immigrants who may be willing to work for lower wages.
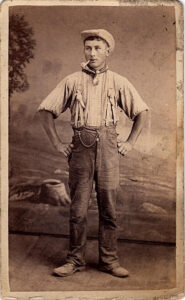
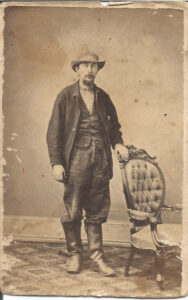
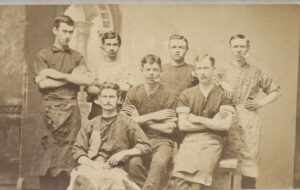
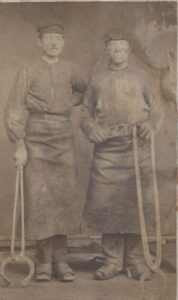
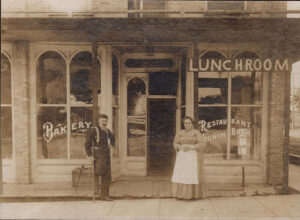
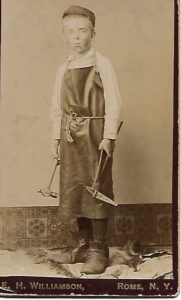
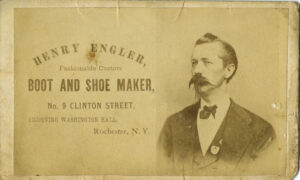
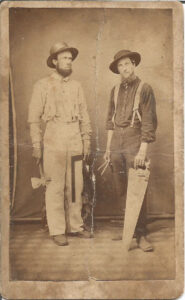
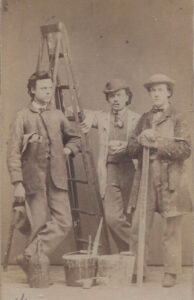
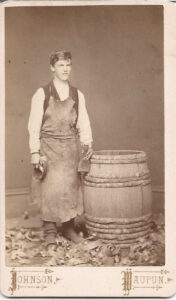
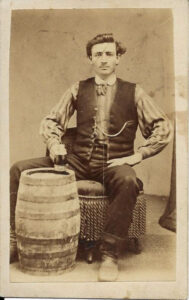
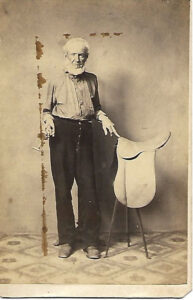
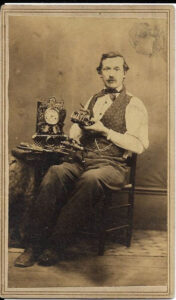
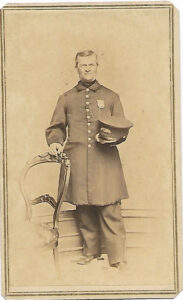
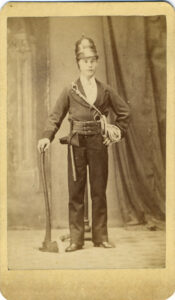
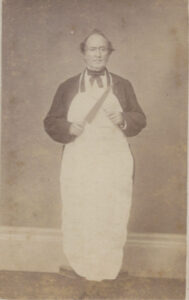
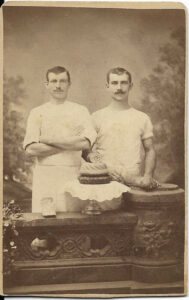
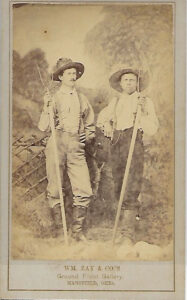
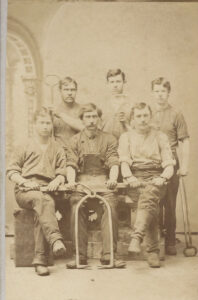
Next comes the new and burgeoning “urban middle class,” working independently or as employees of an established business. Included here are “artisans” who craft functional or decorative goods, from clothing to furniture, household items to jewelry. Others are blacksmiths or carpenters, firemen or trained machinists. Many rely on “brainwork” to succeed as newspapermen, authors, accountants, bank tellers and the like. A few even become entertainers in theaters or circuses.
The next rung up are “professionals,” such as doctors, lawyers, judges, clergymen, engineers, professors and financiers – who tend to acquire unique skills through higher education, then sell this know-how on a pay for service basis to clients in need of their help. Because of their knowledge, people in these “white collar” jobs retain a high level of independence, often “working for themselves” as entrepreneurs. In turn both their incomes and prestige tend to be higher than all but the 2% elite “owner classes,” the southern landed gentry planters and the northern venture capitalists.
The breadth of jobs available varies by the size and geographic location of any given town or city. But in major cities like New York or Philadelphia, the list of occupations is quite amazing.
America’s Emerging Occupations
| Raw Materials | Clothing/Appearance | Professionals |
| Shanties/Lumbermen | Seamstress | Clergymen |
| Miners/Sappers | Hatter | Educators |
| Trappers | Leatherdresser | Doctors |
| Fishermen | Weaver | Attorneys |
| Tanner | Politicians | |
| Transportation/Goods | Tailor/Sartor | Magistrates |
| Coopers/Barrelers | Shoemaker/Cobbler | Judges |
| Rivermen | Tonsors/Barbers | Surveyor |
| Sailors | Military | |
| Teamsters | Personal Transport | Undertakers |
| Draymen | Stablers | |
| Blacksmith/Farrior | Journalists | |
| Converters | Saddler | Printers |
| Textiles | Carriagemaker | Bookbinders |
| Smelters | ||
| Ironworkers | ||
| Plowrights | Food & Drink | Financiers |
| Gunsmiths | Bakers | |
| Clowers/Nailmakers | Butchers | Entrepreneurs |
| Cutlerymakers | Packers | Ship Owners |
| Soapmaker | Brewer/Maltster | Factory Owners |
| Candlemaker | Distillers | Plantation Owners |
| Ropemakers | Other Capitalists | |
| Watchmaker | ||
| Gold/Silversmith | Merchants | Lower Skill Workers |
| Dry Goods | Factory Labor | |
| Housing | Apothecary | Clerks |
| Houseright | Haberdashers | Servants |
| Carpenter | Saloonkeeper | Longshoremen |
| Mason | Innkeeper/Ostler | Rag Pickers |
| Joiner | Peddlers | |
| Glazier | Middlemen | Tinkers |
| Cabinetmaker | Warehousers | Chimneysweeps |
| Locksmith | Factors/Brokers | Waiters |
Another new economic phenomena is the rise of women working away from their farms. One example being the so-called “Lowell Girls” who labor in the textile factories in Massachusetts.
The labor here is strenuous. A typical shift for “Lowell girls” runs from 5AM to 7PM on a production line consisting of 80 workers, two male overseers, and the non-stop racket of spinning and weaving machines and air filled with cotton and cloth detritus.
Each woman works about 70 hours a week and are paid about 5 cents per hour, or around $3 per week – a decent wage at the time, albeit less than their male counterparts.
It is not until the 1850 and 1860 Censuses that the government makes its first attempt at ask citizens about their occupations and wealth. How accurate their responses to the questions are is anyone’s guess.
- Profession, Occupation, or Trade of each person, male and female, over 15 years of age
- Value of person’s real estate
- Value of person’s personal estate
What the data shows is that the average household income, unadjusted for inflation, had jumped from the $65 per year estimate in the 1790’s to around $300 in 1850 for a six day workweek.
While detailed wage data is sparse, economic historians such as Peter Lindert and Samuel Williamson have put together their best estimates for various occupations.
Average Nominal Wages For Workers – Yearly (1840-50)
| Segment | Unit Average | Northeast | South Atlantic | Mid-Atlantic |
| Female Domestics | $113 | $135 | $103 | $100 |
| Females In Manufacturing | 167 | 162 | 161 | 179 |
| Female Teachers | 193 | 187 | 205 | 187 |
| Farm Laborers | 196 | 235 | 158 | 195 |
| Urban Laborers | 269 | 298 | 227 | 282 |
| Miners | 258 | — | 269 | 247 |
| Seamen/Soldiers | 269 | 298 | 227 | 282 |
| Men In Manufacturing | 325 | 334 | 273 | 369 |
| Building Trade | 414 | 412 | 418 | 412 |
| Craftsmen/Artisans | 446 | 444 | 451 | 444 |
| Clergymen | 567 | 600 | 500 | 600 |
| Professors | 590 | 507 | 647 | 617 |
| Lawyers | 1690 | 1320 | 2350 | 1400 |
| Public Commissioners | 1807 | 1275 | 2647 | 1500 |
| Surgeons | 1912 | — | 1912 | — |
| Judges | 2063 | 2081 | 2025 | 2085 |
Lindert-Williamson, U California (Davis)
Government data also record the wages for top earners in the Executive, Legislative and Judicial branches.
Wages For Top Government Officials In 1860
| Position | $ Per Year |
| U.S. President | $25,000 |
| Supreme Court Justices | 6,000 |
| U.S. Senate & House members | 3,000 |
Of course the true measure of household wealth lies in “purchasing power” – what goods and services can be bought with the amount of income one has.
Again data is scarce and largely anecdotal in regard to what things cost in 1860.
One exception is land transactions, some still involving government sales of “public domain” property in new territories, others private transactions between two parties. On average it appears that the price for an acre of land in 1860 is around $3. Thus a typical 50 acre plot would run $150 at a time when the average annual income for farmers is around $200. Bank mortgages become ubiquitous.
Aside from land, information on costs are largely derived from contemporary advertisements in local newspapers. A run-down follows.
| To Buy: | Price |
| 33 oz of whiskey | $.08 |
| 1 lb of tobacco | .10 |
The same can be said for coffee which, at 18 cents per pound of beans, should yield about 36 cups (8 oz size) or roughly a half-penny per serving. Tea is slightly more expensive, with one pound of leaves selling for 75 cents and yielding about 120 cups (8 oz. size).
| To Make One: | Price |
| 8 oz. cup of coffee | $.005 |
| 8 oz. cup of tea | .006 |
| To Buy: | Price |
| 1 lb of salt | $.03 |
| 1 lb of sugar | .08 |
| To Buy: | Price |
| 1 dozen eggs | $.24 |
| 1 lb of cheese | .14 |
| 1 lb of butter | .18 |
| 1 lb of honey | .25 |
| To Buy: | Price |
| 1 lb of corn meal | $.02 |
| 1 lb of flour | .05 |
Beef prices range upward from 3 cents a pound for calf’s veal to 9 cents for salted/preserved options. Pork brings roughly twice as much as beef, with hams and bacon at the top end on pricing. Codfish costs about the same per pound as fresh beef.
| To Buy 1 Lb: | Price |
| Veal | $.03 |
| Fresh Beef | .05 |
| Codfish | .06 |
| Salted Beef | .09 |
| Fresh Pork | .11 |
| Lard | .12 |
| Ham | .14 |
| Bacon | .15 |
| To Buy: | Price |
| 1 lb of sweet potatoes | $.03 |
| 1 lb of rice | .10 |
| To Buy: | Price |
| A single lemon | $.03 |
| 1 lb of dried peaches | .20 |
| To Buy: | Price |
| 1 lb of cotton | $.08 |
| 1 lb of sheep’s wool | .35 |
| To Buy: | Price |
| 1 handkerchief | $ 1.08 |
| 1 flannel shirt | 8.00 |
| 1 pair of trousers | 18.00 |
| 1 bed blanket | 25.00 |
| 1 soldier’s jacket | 32.00 |
| To Buy: | Price |
| 1 pair shoes | $ 12.00 |
| 1 pair of boots | 24.00 |
| To Buy: | Price |
| 1 place setting of blue china | $ 8.00 |
| 1 piano | 195.00 |
| To Buy: | Price |
| 1 routine doctor’s visit | $2.00 |
| Room & board at hotel | 2.29 |
| To Buy: | Price |
| 1 board foot of lumber | $.15 |
| A single finished brick | .08 |
A new home is recorded as sold in Brooklyn for $2,500.
A prospector buys a mining pan for $8.00.
A revolver brings $15.00; a rifle $25.00; a good horse $125.00.
None of these prices are “statistically sound or truly representative.” Still they can be seen in the context of trying to live off of an income that ran around $6 a week or $300 a year. To buy that new $12.00 pair of shoes you want will re require two weeks of your hard labor!
As 1860 and the Civil War approach, sharp economic difference exist between those living in the North and the South.
In the North, especially the New England states, urban centers and dynamic marketplaces have developed, and a new cohort of “middle class” residents are working for wages in diverse businesses. Farming remains the dominant occupation in the North, but its importance is already beginning to wane.
Meanwhile the South remains largely resistant to these shifting tides. It desperately tries to hold on to its agrarian roots, boasting that “Cotton is King,” defending slave labor, and touting what it sees as its more refined, less materialistically driven culture.
By 1860, however, the balance of power between the two regions has shifted from colonial times. Instead of the 50-50% population split in 1790, the North now dominates by 61-39% in 1860 – a signal of its superior economic diversity.
A guesstimate of the economic classes is as follows:
Guesstimated Economic Classes For Whites In 1860
| % of US Pop | Cohort | Wealth |
| 27% | Small Southern farmers without slaves | Below average |
| 11 | Small farmers with slaves | Above average |
| 1 | Large plantations with slaves | Very rich |
| 39% | Total South | |
| 33 | Northern farmers | Average |
| 10 | Factory workers/day laborers | Below average |
| 7 | Independent artisans | Above average |
| 7 | Typical business employees | Average |
| 3 | Professionals | Above average |
| 1 | Venture capitalists/tycoons | Very rich |
| 61% |

